


Human Gd-IgA1(Galactose-Deficient IgA1) ELISA Kit
 One-click to copy product information
 Size: Size: |
 Price: Price: |
|---|---|
| 48 T | $320.00 |
| 96 T | $458.00 |
| 96 T*5 | $1947.00 |
 Manual
 Overview
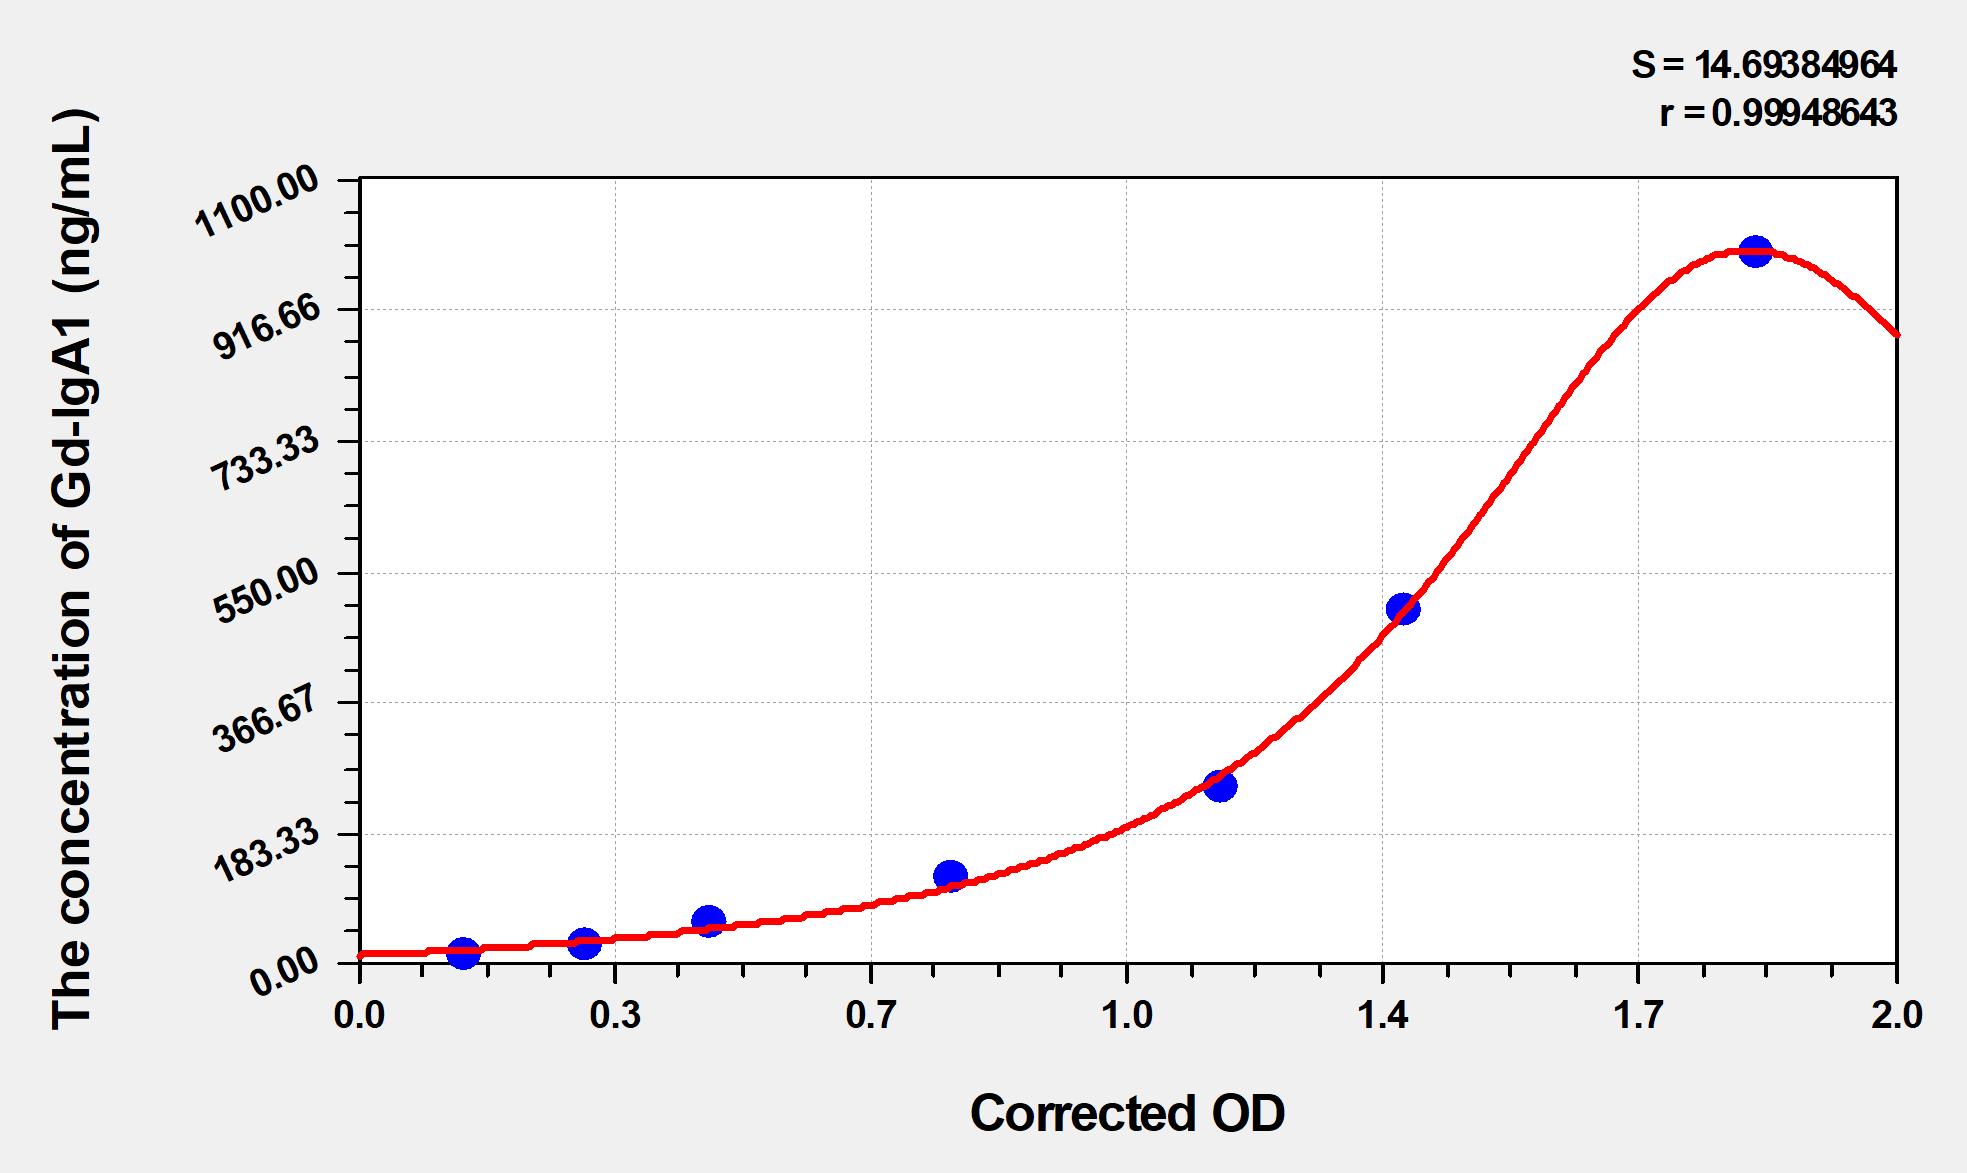
Standard curve
| Concentration (ng/mL) | OD | Corrected OD |
|---|---|---|
| 1000.00 | 1.941 | 1.859 |
| 500.00 | 1.472 | 1.390 |
| 250.00 | 1.227 | 1.145 |
| 125.00 | 0.872 | 0.790 |
| 62.50 | 0.547 | 0.465 |
| 31.25 | 0.384 | 0.302 |
| 15.63 | 0.221 | 0.139 |
| 0.00 | 0.082 | 0.000 |
Precision
Intra-assay Precision (Precision within an assay):CV%<8%
Three samples of known concentration were tested twenty times on one plate to assess intra-assay precision.
Inter-assay Precision (Precision between assays):CV%<10%
Three samples of known concentration were tested in forty separate assays to assess inter-assay precision.
Recovery
Matrices listed below were spiked with certain level of recombinant Gd-IgA1 and the recovery rates were calculated by comparing the measured value to the expected amount of Gd-IgA1 in samples.
| Matrix | Recovery range | Average |
|---|---|---|
| serum(n=5) | 85-97% | 91% |
| EDTA plasma(n=5) | 92-105% | 98% |
| Heparin plasma(n=5) | 82-95% | 88% |
Linearity
The linearity of the kit was assayed by testing samples spiked with appropriate concentration of Gd-IgA1 and their serial dilutions. The results were demonstrated by the percentage of calculated concentration to the expected.
| Matrix | 1:2 | 1:4 | 1:8 | 1:16 |
|---|---|---|---|---|
| serum(n=5) | 90-98% | 85-92% | 83-96% | 93-102% |
| EDTA plasma(n=5) | 92-105% | 85-101% | 85-94% | 87-96% |
| Heparin plasma(n=5) | 86-97% | 88-95% | 92-101% | 87-98% |